RMS to Peak-peak Jitter Calculator | Back to Development Calculators
You're working with a signal containing only random noise, and you know its jitter value in seconds RMS. For this calculator, the applicable type of jitter for data signals is time-interval error (TIE). For clock signals, the applicable type of jitter may be anything (TIE, period jitter, cycle-to-cycle jitter, etc.). In any event, if the jitter distribution is Gaussian, it is characterized by a standard deviation σ as shown below.
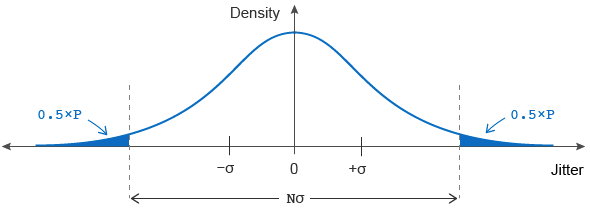
Note that since the distribution's mean is zero, its RMS value equals σ. The height of the distribution relates to the probability that the signal has that much jitter.
Your application was designed to have a certain level of reliability. From this, you can derive an acceptable limit for the probability P that the system may fail when the jitter becomes too large. Graphically, this probability equals the solid-colored area in the figure above as a percentage of the distribution's total area. For example, a six-sigma design (e.g. σ=±3) runs error-free 99.73% of the time (so P=0.0027, which represents an average failure rate of 0.27%).
You want to know what the peak-peak value of jitter is for this probability of error, P
The peak-peak value is computed as Nσ, where N is a crest factor determining how much of the Gaussian tail needs to be included to produce the probability of error P. The calculator computes this peak-peak value after solving the following equation for N,
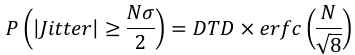
where DTD is the signal's data-transition density, and erfc is the complementary error function. For data signals, DTD is defined as the ratio of transitions (or, edges) to the number of bits. For clock signals, set DTD=1.
Enter numbers below using integers or scientific notation (for example, enter 123 as 123, 1.23e2, or 1.23E2).
RMS to Peak-peak Jitter Calculator
The following table is provided for quick reference.
| Probability (P) | Crest Factor (N) | |
| DTD = 0.5 | DTD = 1 | |
| 1e-1 | 2.563 | 3.290 |
| 1e-2 | 4.653 | 5.152 |
| 1e-3 | 6.180 | 6.581 |
| 1e-4 | 7.438 | 7.781 |
| 1e-5 | 8.530 | 8.834 |
| 1e-6 | 9.507 | 9.783 |
| 1e-7 | 10.399 | 10.653 |
| 1e-8 | 11.224 | 11.461 |
| 1e-9 | 11.996 | 12.219 |
| 1e-10 | 12.723 | 12.934 |
| 1e-11 | 13.412 | 13.613 |
| 1e-12 | 14.069 | 14.261 |
| 1e-13 | 14.698 | 14.882 |
| 1e-14 | 15.301 | 15.479 |
| 1e-15 | 15.883 | 16.054 |
| 1e-16 | 16.444 | 16.610 |