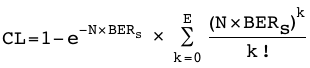
In the lab, we don't need to know the true BER of our system. We simply need to measure enough data to have some confidence that the BER is lower than some specified level. The question then becomes, if we repeatedly transmit N bits, and detect E errors, what percentage of the tests will the measured BER (that is, E/N) be less than some specified BER (such as, BERS)? We call this percentage the BER confidence level (CL × 100%), and calculate it using the Poisson distribution as follows.
In other words, CL × 100 is the percent confidence that the system's true BER (i.e. if N = infinity) is less than the specified BER (e.g. BERS). That is, if the measurement is repeated an infinite number of times, the measured BER will be less (that is, better) than the specified BER for CL × 100% of the tests.
Since we cannot measure for an infinite length of time, the BER confidence level is always less than 100% (at least theoretically). Before starting a BER measurement, one must identify a target confidence level. Some industry standards specify this level (many do not), and 95% is a reasonable target. All industry standards specify a maximum system BER (what we call BERS here).
BER Test: Confidence-level Calculator
Use the calculator below to determine the confidence level for a BER lab measurement by entering the specified BER, the data rate, the measurement time, and the number of detected errors. For reference, the number of transmitted bits (N) is shown as the data rate (BPS) multiplied by the measurement time (T).
Alternatively, one can determine how many bits must be measured in the lab (that is, how much time is required to measure data) to achieve a specific confidence level, assuming a certain number of errors (usually, 0 errors) — simply enter BERS, BPS, and E, then change T until the desired confidence level is found.
Enter numbers below as integers, or use scientific notation (for example, enter 123 as 123, 1.23e2, or 1.23E2).
BER Testing Example
For example, how many bits must transmit error free to give a 95% confidence level that the true BER is less than 10-12? In the calculator, enter BERS = 1e-12, E = 0, and the desired BPS. We then change T until the confidence level is 95%. In this way, we find N = 3×1012 bits (for example, when BPS = 10e9, and T = 5 minutes).
This illustrates a useful rule of thumb: measuring 3÷BERS number of bits with no errors gives 95% confidence of meeting the specified BER.
Another way of interpreting this result is, if the measurement is repeated an infinite number of times, the measured BER is less (that is, better) than the specified BER for 95% of the tests.
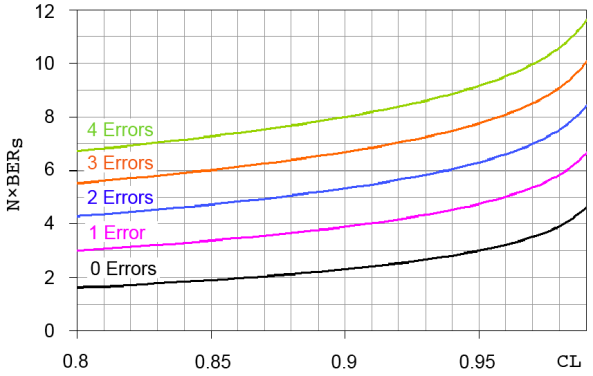
The calculator is used to generate the following graph.
This graph can be used a couple ways. If you want to calculate the BER confidence level for a particular measurement, multiply the number of transmitted bits by the specified BER, and draw a horizontal line at this point on the Y-axis. Find the appropriate curve for the number of detected errors, and draw a vertical line where this curve intersects the horizontal line that was just drawn. The confidence level for your measurement is where this vertical line intersects the X-axis.