Content
3. Estimation of EMI Reduction in Spread Spectrum Clocks
4. The Effects of Spread Spectrum on Clock Harmonics
4.1 Triangular and Hershey-Kiss Profiles
1. Introduction
With increasing processor speeds and data rates in today’s electronic systems, electromagnetic interference (EMI) has become a major challenge for designers. EMI generated in one device can impede the operations of other electronic devices in its proximity.
The clock is often the largest contributor of EMI in a system. The frequency spectrum of square-wave clocks consists of a fundamental tone as well as a collection of higher harmonics. Filtering, shielding, and good PCB layout practices can limit EMI in a system, but they add cost and consume valuable board space. An alternate approach is to reduce the noise generated by the clock. By modulating the clock frequency slowly over time, the peak spectral energy in both the fundamental and harmonic frequencies is reduced. This reduction is useful because regulatory governmental agencies, such as the FCC or CE, use the peak power within a specific bandwidth, typically 100 kHz to quantify radiated EMI.
2. Spread Spectrum Benefits
The output of spread spectrum clocks, such as those within the SiT9002, SiT9003, SiT9005, and SiT9025 oscillator families, are conditioned by modulating its PLL with 32 kHz periodic waveforms such as triangular or Hershey-Kiss profiles. Figure 1 shows a block diagram of a spread spectrum clock using a triangular waveform as the modulating waveform.
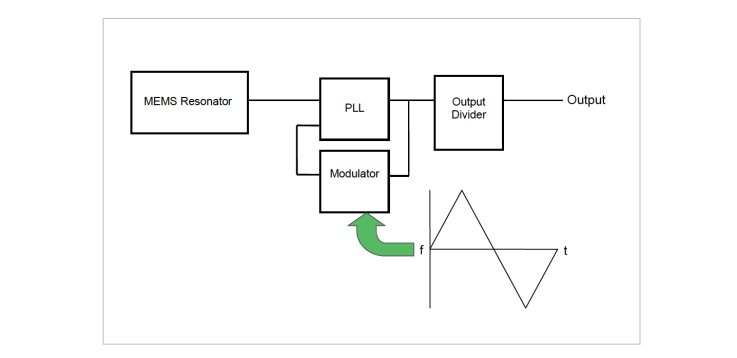
Figure 1. Modulating the PLL with a Triangular Wave
The spreading profile contains a number of user selectable parameters depending on the device family as shown in Error! Reference source not found. below.
Table 1. Parameters of SiTime Spread Spectrum Oscillators
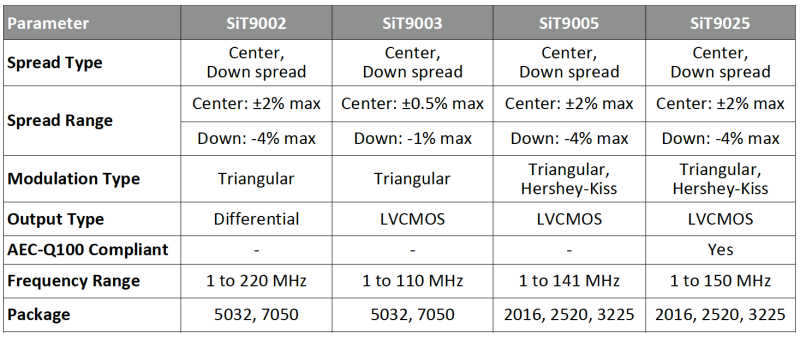
If the nominal clock frequency is 100 MHz, selecting a ±1% center spread will limit the output frequency from 99 MHz to 101 MHz. Similarly, choosing a -2% down spread will cause the output frequency to range from 98 MHz to 100 MHz.
A triangular profile was chosen as the modulating signal because it has a reasonably flat power density in the frequency domain. Figure 2 shows the spectrum plot of a non-spreading clock and that of a spread spectrum clock. By intentionally spreading the energies stored in a non-spreading clock over a small range of frequencies, a reduction in spectral amplitude is achieved.
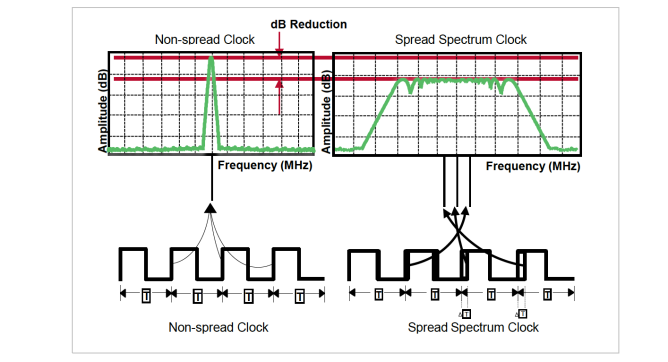
Figure 2: Non-spreading Clock and a Spread Spectrum Clock Measured by a Spectrum Analyzer with a 100 kHz Resolution Bandwidth
To better understand the noise reduction benefits of a spread spectrum clock, a spectrum analyzer was used to measure the peak power of a 125 MHz SiT9002 oscillator with and without the spreading feature enabled. In this test, a down spread of -2% was chosen.
Figure 3 shows the output of the spectrum analyzer. With the spreading feature turned on, the EMI reduction to the average level of the spread spectrum is 13 dB (marker 3 to marker 1) while the peak-to-peak reduction is 11 dB (marker 3 to marker 2).
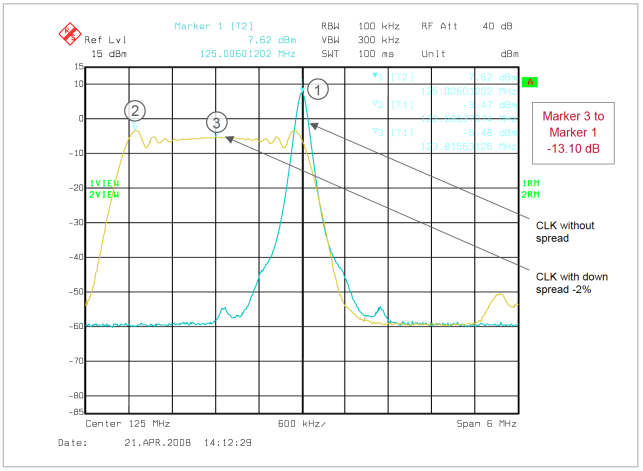
Figure 3: Noise Reduction Benefits of a Spread Spectrum Clock
3. Estimation of EMI Reduction in Spread Spectrum Clocks
It is often desirable to estimate the EMI reduction without resorting to laboratory measurements. The following equation can be used to calculate estimates:

where S is the peak-to-peak spread percentage, fc is the carrier frequency and RBW is the resolution bandwidth of the spectrum analyzer. For clock measurements, the RBW is typically set to 100 kHz.
Lab measurements can validate the EMI reduction estimated from Equation 1. With the SiT9002 operating at 125 MHz and a down-spread of 2%, the calculated EMI reduction is:
The estimated value is close to the measured peak-to-average value of 13 dB. However, it is 3 dB higher than the peak-to-peak value of 11 dB due to the ripples in the spread spectrum. This should be taken into account when estimating the peak-to-peak EMI reduction using Equation 2.
To better analyze the accuracy of the above equation, the EMI reductions of a SiT9002 at three different down-spread percentages was measured and compared against the calculated values. The results are shown in Figure 4. The dash lines represent the estimated values whereas the solid lines indicate the measured peak-to-average values using a Rohde & Schwarz spectrum analyzer. The plots shown illustrate that the estimated values are typically within ±1 dB of the measured values.
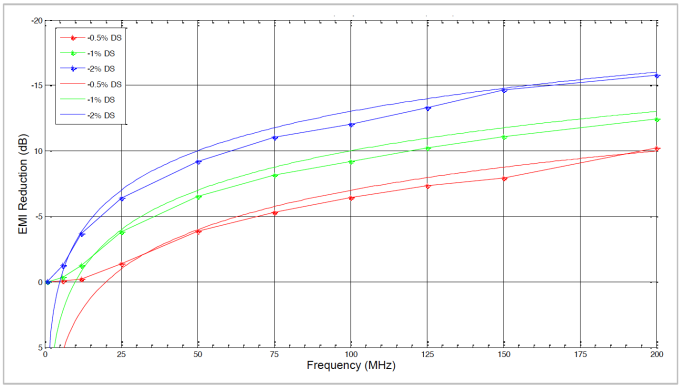
Figure 4: Calculated EMI Reductions vs Measured Values
4. The Effects of Spread Spectrum on Clock Harmonics
Regulatory compliance includes the fundamental as well as the harmonic frequencies of a clock.
Sections 2 and 3 described the effects of spread spectrum on the fundamental frequency. The effect of spread spectrum to reduce EMI in the fundamental frequency also applies to the harmonics.
Equation 1 shows that the amount of EMI reduction is directly proportioned to the frequency. To verify this, the spectrum of a 100 MHz SiT9002 was measured with and without 2% down-spread at its fundamental frequency (100 MHz), at the third harmonic (300 MHz), and at the fifth harmonic (500 MHz). The results are shown in Figures 5 and 6.
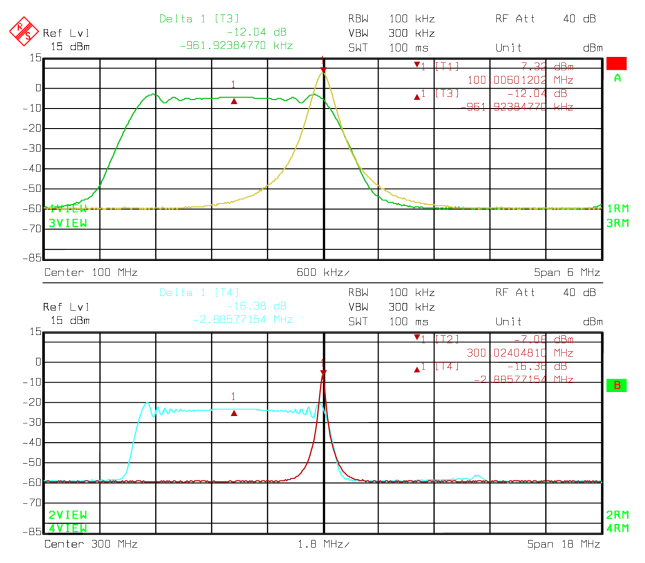
Figure 5: Spectrum Plots of a 100 MHz SiT9002 at 100 MHz and 300 MHz
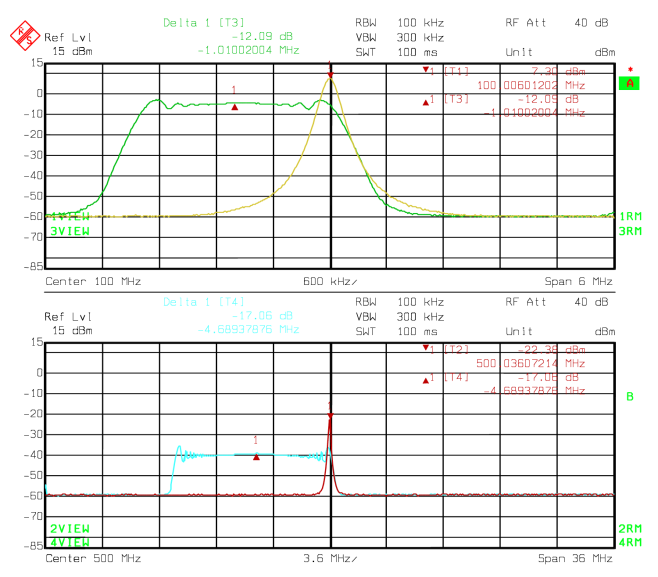
Figure 6: Spectrum Plots of a 100 MHz SiT9002 at 100 MHz and 500 MHz
The EMI reduction from spread spectrum at the fundamental frequency (100 MHz) is 12.09 dB. It increased to 16.38 dB at the third harmonic (300 MHz) and to 17.06 dB at the fifth harmonic (500 MHz). In other words, spread spectrum reduces EMI for all the frequency components in the clock output.
4.1 Triangular and Hershey-Kiss Profiles
The difference between the triangular and Hershey-Kiss profile is apparent in the peaking of the ear lobes of the resulting power spectra. As shown in Figure 7, the triangular profile has a marked peaking around the inflexion point resulting in peaking ear lobes. This spectral peaking is eliminated in a Hershey-Kiss profile.
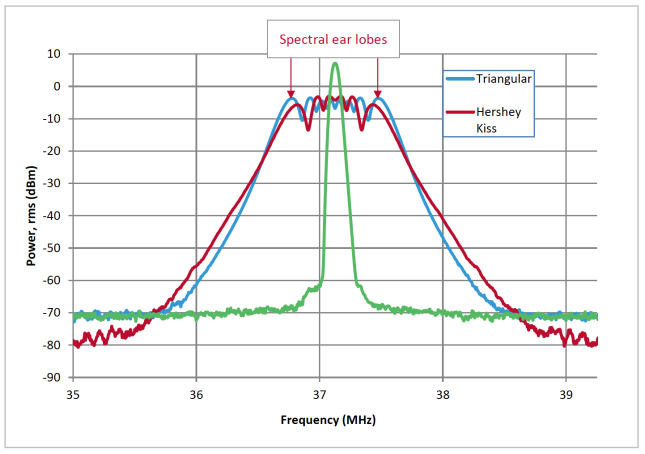
Figure 7: Triangular and Hershey-Kiss Profile Plots of a 37 MHz SiT9005 Showing Spectral Ear Lobe Peaking for Triangular Profile
The effective spectral power reduction depends on the spread and not on the type of profile used. The formula listed in Equation 1 can be used for either profile to estimate EMI reduction. The choice of which profile to use depends on the individual system EMI compliance scenario. In the case of EMI compliance failure at frequencies where the triangular profile related peaking ears reduce the margin, a Hershey-Kiss profile may help.
5. Conclusion
The spread spectrum feature in SiTime oscillators offers excellent EMI reduction at its outputs, making these devices ideal for noise-sensitive applications and a preferred alternative to costly PCB board changes or EMI suppressant materials.
Table 1: Revision History