The Top 8 Influencers of Stability in Precision Timing
Oscillators, such as temperature-compensated oscillators (TCXOs) and oven-controlled oscillators (OCXOs) are used because of their exceptional frequency stability. They produce a very precise and consistent electrical signal at a specific frequency, providing the heartbeat to digital electronic systems. Maintaining frequency stability is extremely important in many applications—from communications, enterprise and datacenters to automotive, industrial and defense.
Temperature is one of the major factors that can affect the stability of an oscillator. Changes in a system’s temperature environment create corresponding changes in an oscillator’s output frequency. Therefore, the main specification found in TCXO and OCXO) datasheets is frequency-over-temperature stability. This specification is expressed in parts per million (ppm) or parts per billion (ppb) which is referenced to the nominal output frequency. It represents the deviation of the oscillator’s frequency over the designated operating temperature range.
But frequency-over-temperature stability on its own isn’t enough to predict the performance of a precision oscillator in a real-life system. In practice, different stability specifications in an oscillator datasheet account for the many factors that contribute to stability, and these specifications must be carefully considered when evaluating a system’s overall stability.
A TCXO employs temperature sensors and temperature-compensation circuitry to reduce the effect of fluctuating temperatures to ±100 or even ±5 ppb across temperature. An OCXO employs oven-control loop comprising an internal heating element, temperature sensor and control circuitry, essentially creating a miniature oven that maintains a consistent internal temperature higher than the operating ambient temperature. This further minimizes the effect of ambient temperature variation to achieve a ±1 ppb stability in OCXOs.

At such low ppb levels, other noise sources and environmental conditions in the application can become significant. For example, acceleration, vibration, supply noise, load changes, airflow, thermal gradients, and high temperatures can impact the system’s overall stability much more than is predicted by the oscillator’s frequency-over-temperature specification. Separate specifications of stability for each of these contributing system factors enable designers to add their contributions for a given system to better predict overall stability.
In addition to different oscillator classes such as TCXO or OCXO, there are different timing technologies—such as quartz or MEMS (micro-electro-mechanical systems)—that yield different stability-related results, especially in parameters that measure performance under varying environmental conditions.
Bottom line, when stability is essential, a complete list of contributing factors must be considered. Depending on the application, one or more of these factors may be more important than the widely publicized frequency-over-temperature stability number. Here are the top 8 contributors to overall frequency stability output by a precision oscillator along with performance comparison examples.
1. Frequency-over-temperature stability
This specification is the banner specification for precision oscillators because the oscillator’s output frequency can be significantly influenced by temperature. This specification describes how the output frequency may change within a specified ambient temperature range over the lifetime of the device and includes thermal-hysteresis effects.
Read our application note TCXO and OCXO Stability Degradation for data and analysis of various TCXO and OCXO behavior at temperatures that exceed +70°C/+85°C to understand how such devices behave outside their rated temperature range and to determine to what extent the system can maintain service during fault conditions.
2. Thermal hysteresis
Thermal hysteresis is the maximum difference between two measurements: the frequency as temperature rises from the bottom of the specified temperature range to the top, and the frequency as the temperature lowers from the top of the specified temperature range back down to the bottom. When plotted, the two curves form the shape of an eye. The maximum vertical difference between the two curves (or the tallest part of the “eye”) is usually specified. The realized stability can’t be made smaller than its hysteresis, making hysteresis a limiting factor for overall stability.
3. Frequency-over-temperature slope
This describes how the output frequency changes due to fluctuations in temperature. It’s also referred to as frequency-versus-temperature slope, abbreviated as dF/dT, and is specified in units of ppb/°C. Typically, temperature ramp rates are 0.5°C/min or 1°C/min, although they can be as high as 5°C/min for systems deployed in harsh environments.
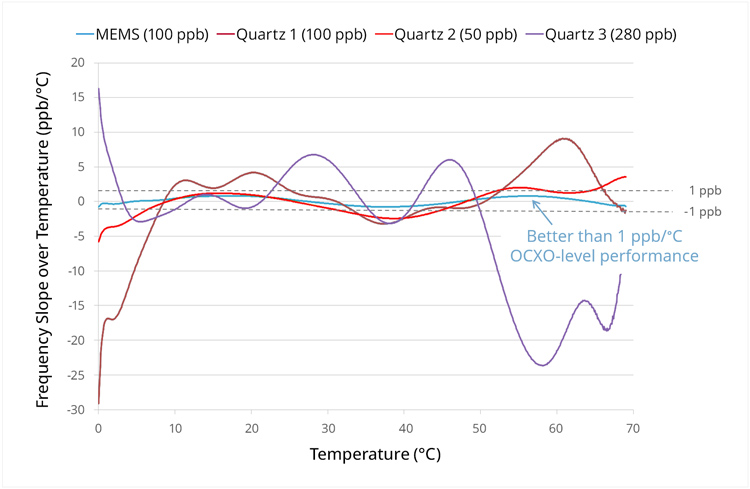
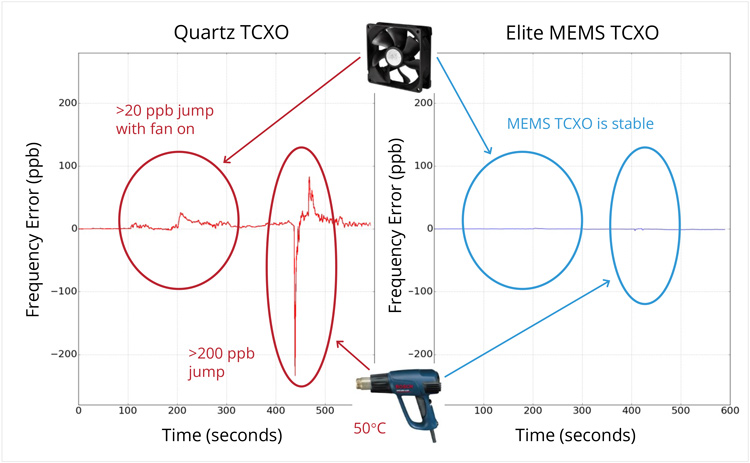
Figure 1 illustrates the variety of TCXO performance found in the open market and reinforces the fact that the banner frequency-over-temperature value doesn’t necessarily correlate with its frequency-over-temperature slope. Figure 2 shows the impact of poor dF/dT performance based on environmental stressors such as rapid temperature transients.
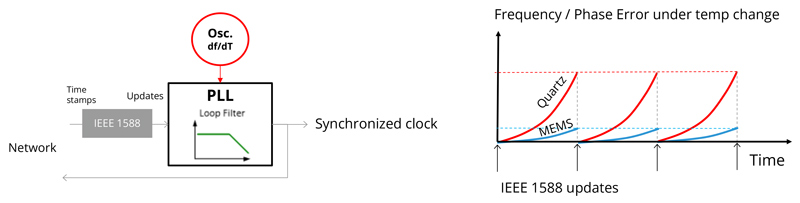
For certain applications where the oscillator is disciplined to an upstream master, such as those using the IEEE 1588 protocol, the frequency-over-temperature slope is much more important than the frequency-over-temperature value. See Figure 3. Applications sensitive to frequency-over-temperature slope must prioritize this specification above the frequency-over-temperature specification.
4. Initial tolerance
This quantifies the accuracy of the oscillator’s initial frequency compared to its target frequency at a given temperature, typically 25°C, and is specified in units of ppm. Systems requiring high accuracy can minimize initial tolerance by calibrating the oscillator against a more accurate reference during production before shipping to customers. Periodic calibration may be necessary to account for aging that causes the system to fall out of specification.
5. Aging
Aging quantifies how the output frequency changes over time when external factors (such as ambient temperature and supply voltage) are held constant. This specification is typically specified for one day, one year, 10 years, and 20 years.
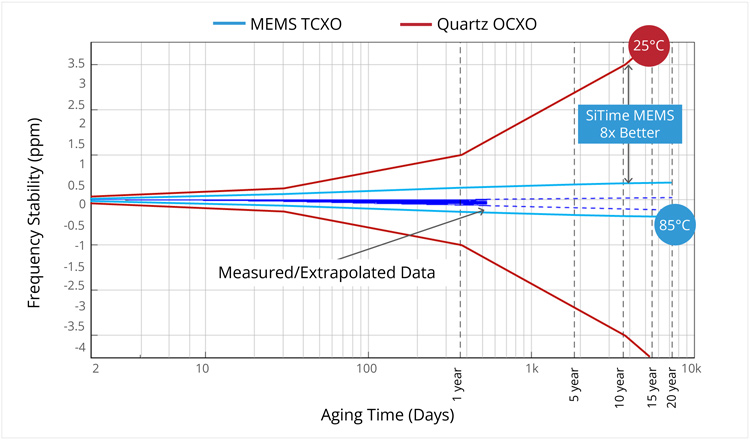
Read our Aging in OCXO and TCXO whitepaper for more on frequency aging theory and to dive into the critical factors affecting aging of quartz-based and MEMS-based oscillators. Through an extrapolation of a mathematical aging model, long-term performance predictions are made. The model compares predicted aging performance with actual aging measurement results.
6. Voltage sensitivity
This describes how oscillator output frequency changes with the oscillator’s power-supply voltage. For this reason, it’s better to use regulated power supplies to minimize supply voltage variations. Integrating such regulation into an oscillator package makes devices more robust in noisy board environments and eliminates the need for dedicated external regulation, potentially saving valuable space in the system.
7. Load sensitivity
Load sensitivity is another factor influenced by electrical conditions, indicating how much the oscillator is affected by the connected circuit's loading characteristics. It defines how oscillator output frequency changes with changes in capacitive load (CL) observed by its resonator. This effect is expressed in ppm or ppb at a specified pico-farad capacitance.
8. Sensitivity to vibration
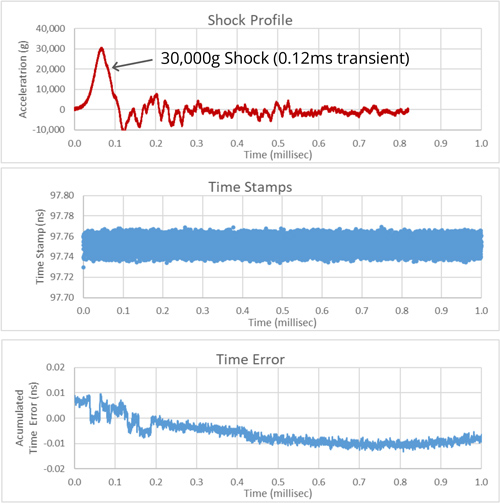
g-sensitivity (where g is the acceleration of gravity) describes how the output frequency changes under acceleration. Because acceleration can occur in any combination of three axes in space, the root-sum-square of acceleration sensitivity per each axis equals the total g-sensitivity, or Gamma vector, expressed in units of ppb/g. See Figure 5. This number is particularly important for mission-critical systems in aerospace and defense applications in which the oscillator is subjected to large g forces by factors such as jet or rocket propulsion.
Application Impact on Frequency Stability
Although both quartz and MEMS oscillators may have equal banner specifications for frequency-over-temperature stability, selecting a device based only on this value can lead to dramatically different results in overall system frequency stability. The application should dictate which stability parameter is most critical.
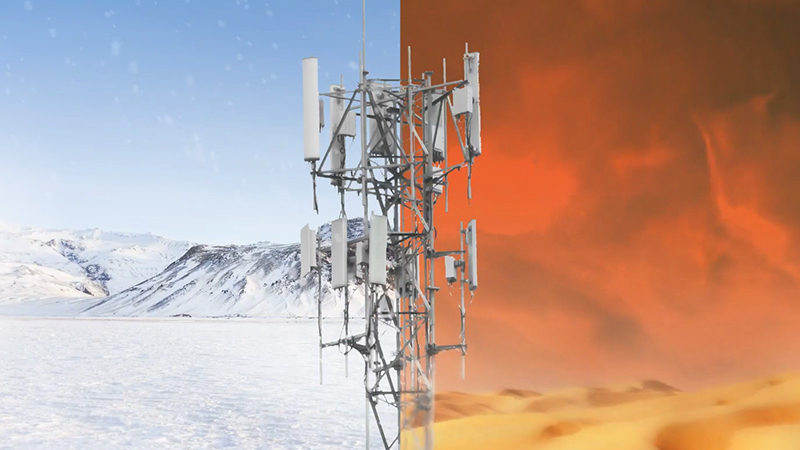
For example, exposing an outdoor 5G radio to a sudden rain shower can quickly drop its internal ambient temperature 10°C. Alternatively, large bursts in data center traffic can quickly heat up a SoC or processor by 10°C. An oscillator can sense such changes via coupling to its environment, degrading its overall stability via dF/dT. For the devices in Figure 1, the quartz TCXOs degrade between ±200 and ±500 ppb versus just ±35 ppb for the MEMS device.
In addition, aging will cause the quartz device’s frequency to shift significantly more than that of MEMS devices. For each aging specification—daily, yearly, and 20 years—a quartz device’s frequency shift can be much worse than predicted. That’s because the quartz oscillator aging is usually quoted at room temperature in the datasheet, compared to 85°C for SiTime MEMS Super-TCXOs and 50°C for SiTime MEMS OCXOs. Excessive heat increases aging in quartz resonators much more than in MEMS resonators.
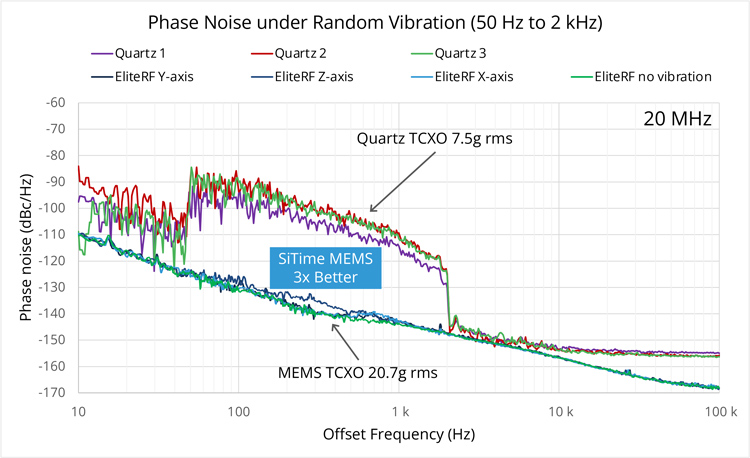
Alternatively, subjecting a radio mounted on an outdoor pole to 1 g of shock from wind-induced vibration can shift the frequency of internal quartz devices by ±0.5 to ±5 ppb, compared to ±0.004 to ±0.1 ppb for MEMS devices. Furthermore, because quartz is a piezoelectric device, mechanical vibration can significantly degrade its phase-noise performance, whereas MEMS oscillators are electrostatic-based and therefore resistant to degradation.
Stability is more than just a number. For a thorough consideration of factors that can influence oscillator stability and therefore overall system performance, designers should look beyond the banner specification of frequency-over-temperature stability. The true picture of stability requires drilling down to other relevant system attributes. These include thermal hysteresis, frequency-over-temperature slope, initial tolerance, aging, voltage, and load sensitivities, as well as acceleration. Only then can a comprehensive understanding of the device’s performance under all conditions be accurately evaluated for the system.
Watch a video demonstration of dynamic performance as a best-in-class 50-ppb quartz TCXO is compared to a 50-ppb MEMS TCXO in a side-by-side test of the two devices simultaneously subjected to common environmental conditions such as airflow, temperature ramp, shock, and VDD fluctuation.