Content
2. Pull Range, Absolute Pull Range
3. Upper & Lower Control Voltages
1. Introduction
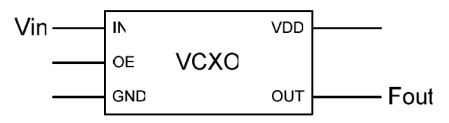
Figure 1. VCXO Block Diagram
VCXO are frequency control devices that allow change of output frequency as their input voltage varies. In selecting a VCXO for any application, a number of device performance specifications must be considered. This application note attempts to clarify the key VCXO specific performance specifications, and to illustrate some of the tradeoffs associated with using a VCXO in an application.
2. Pull Range, Absolute Pull Range
Pull range (PR) is the amount of frequency deviation that will result from changing the control voltage over its maximum range under nominal conditions.
Absolute pull range (APR) is the guaranteed controllable frequency range over all environmental and aging conditions. Effectively, it is the amount of pull range remaining after taking into account frequency stability tolerances over variables such as temperature, power supply voltage, and aging, i.e.:

where F-stability is the device frequency stability due to initial tolerance and variations on temperature, power supply, and load.
Figure 2 shows a typical SiTime VCXO FV characteristic. The FV characteristic varies with conditions, so that the frequency output at a given input voltage can vary by as much as the specified frequency stability of the VCXO. For such VCXOs, the frequency stability and APR are independent of each other. This allows very wide range of pull options without compromising frequency stability.
Figure 3 shows a typical quartz-based VCXO frequency vs. voltage (FV) characteristic. For quartz-based VCXOs, to get a higher APR it is usually necessary to use a lower-Q crystal to make the crystal more “pullable.” However, this also has the effect of degrading frequency stability. Therefore, a tradeoff must be made between the minimum APR required by the application, and the minimum frequency stability available with that APR. Generally, it is best to choose the lowest APR that meets the application’s requirements.
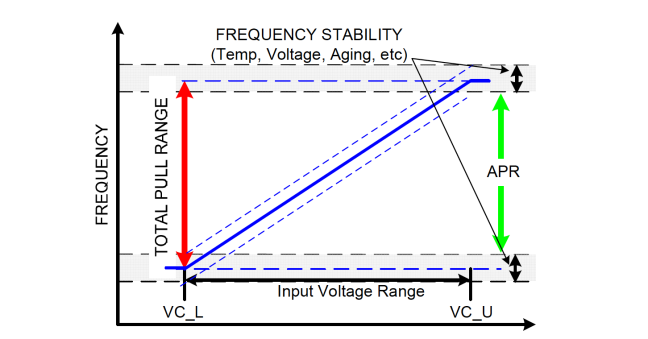
Figure 2: Typical SiTime VCXO FV Characteristic
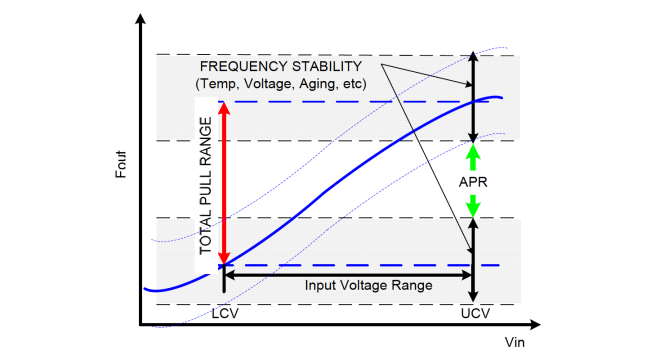
Figure 3: Typical Quartz VCXO FV Characteristic
3. Upper and Lower Control Voltages
The upper and lower control voltages are the specified limits of the input voltage range (See Figure 2). Applying voltages beyond the upper and lower voltages do not result in noticeable changes of output frequency. In other words, the FV characteristic of the VCXO saturates beyond these voltages. Figures 1 and 2 show these voltages as Lower Control Voltage (VC_L) and Upper Control Voltage (VC_U).
4. Linearity
In any VCXO, there will be some deviation of the FV characteristic from an ideal straight line. Linearity is the ratio of this maximum deviation to the total pull range, expressed as a percentage.
Typical quartz-based VCXOs achieve the frequency control function by a varactor, which leads to a curved FV characteristic (Figure 4). Linearity specifications for these devices are typically in the 5% to 10% range, as shown in Figure 5. For comparison, Figure 6 shows the linearity of SiTime’s 380X-series VCXOs. The characteristic is extremely linear, typically much less than 1% (Figure 7).
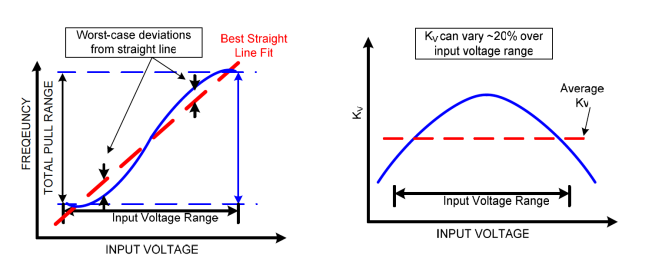
Figure 4: Typical Quartz VCXO Linearity | Figure 5: Typical Quartz VCXO Kv Variation
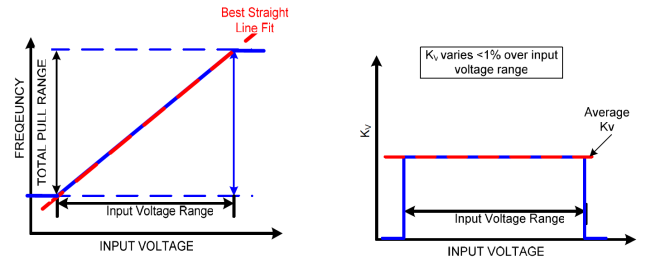
Figure 6: Typical SiTime VCXO Linearity | Figure 7: Typical SiTime VCXO Kv Variation
5. FV Characteristic Slope, Kv
The slope of the FV characteristic is a critical design parameter in many low-bandwidth PLL applications. The slope is the derivative of the FV characteristic – the deviation of frequency divided by the control voltage change needed to produce that frequency deviation, over a small voltage span, as shown below:

It is typically expressed in kHz/volt, MHz/volt, PPM/volt, or similar units. Slope is usually called “KV” based on terminology used in PLL designs.
The FV characteristic slope of a standard quartz-based VCXO may vary significantly over the input control voltage range, typically 10-20%. Some datasheets may specify an “average” Kv as typical, but since Kv affects important PLL performance parameters such as bandwidth and phase margin, the entire Kv variation must be understood and accounted for in a successful design.
Figure 5 and Figure 7 show typical quartz-based and SiTime VCXO 380X family Kv characteristics. The extreme linear characteristic of the SiTime 380X VCXO family means that there is very little Kv variation across the whole input voltage range (typically <1%), significantly reducing the design burden on the PLL designer.
6. Frequency Change Polarity
Frequency change polarity specifies whether the slope of the voltage-frequency characteristic is positive (increasing voltage increases output frequency) or negative (increasing voltage decreases output frequency). SiTime 380X family of VCXOs provide positive slope option. Contact SiTime for negative slope option.
7. Control Voltage Bandwidth
Control voltage bandwidth, sometimes called “modulation rate” or “modulation bandwidth”, is the rate at which the output frequency can track an input voltage change. The ratio of the output frequency variation to the input voltage variation, previously denoted by Kv, has a low-pass characteristic in most VCXOs. The modulation rate is defined as the modulation rate for which the Kv is reduced by 3 dB relative to Kv for DC inputs swept in the same voltage range.
For example, a part with a +/-150 ppm pull range and a 0-3V control voltage can be regarded as having an average KV of 100 ppm/V. Applying an input of 1.5V DC ± 0.5V causes an output frequency by 100 ppm (+/-50 ppm). If the control voltage bandwidth is specified as 8 kHz, the peak-to-peak value of the output frequency change will be reduced to 100 ppm/%2 or 71 ppm, as the frequency of the control voltage is increased to 8 kHz.
8. Conclusion
This document has defined and clarified the most important of the VCXO performance specifications, and illustrated some of the important differences in these specifications between legacy quartz VCXOs and SiTime VCXOs. A more detailed discussion of the tradeoffs between performance parameters will be given in a separate document.